
IDE walkthrough
The entire JasperNode product is a browser IDE served by the runtime. This page tours it screen-by-screen so you know where everything lives. To follow along, open the IDE (see Getting started).
The images are real captures of a running node — a fumigation-chamber control system — so the tag names and values are a real project’s, not mock-ups.
The persistent frame
Section titled “The persistent frame”Every screen sits inside the same chrome:
- Left icon rail — the JasperNode logo sits at the top, above the primary navigation: Overview, Flows, Tag Tree, Connector Manager, and Diagnostics. At the bottom: toggles for the AI chat panel, dark mode, and your account menu.
- Right edge — the AI Agent panel. Always docked on the right (resizable, collapsible). Press
⌘K/Ctrl+Kto focus it. - Bottom status bar — node health, connector counts (active / configured / errors), the Logic Cycle Stop/Start control, and the version. A floating Logger button opens a log drawer from the bottom on most screens.
Overview
Section titled “Overview”The landing dashboard — system health and live signals at a glance.
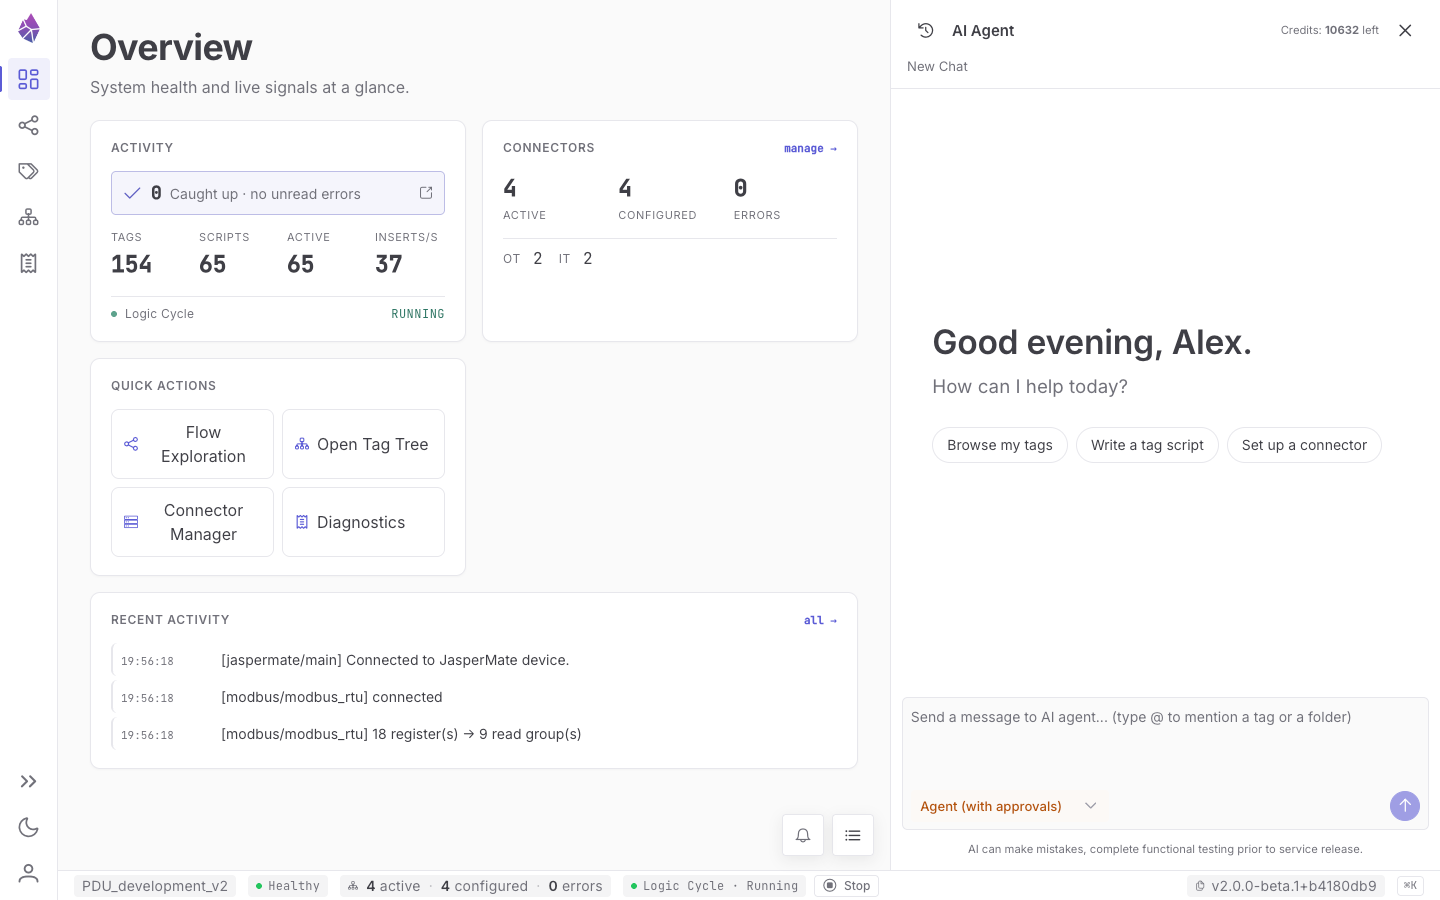
Every element on it:
| Card | Element | What it is |
|---|---|---|
| Activity | unread-errors banner | N unread errors since you last checked, or Caught up · no unread errors — click to open them. |
| Tags | How many tags exist. | |
| Scripts | How many scripts exist. | |
| Active | How many scripts are currently active. | |
| Inserts/s | Tag value writes per second right now. | |
| Logic Cycle indicator | Whether the script runtime is RUNNING or stopped. | |
| Connectors | Active / Configured / Errors | Live connector counts. |
| OT / IT | The split between fieldbus and network connectors. | |
| manage → | Opens the Connector Manager. | |
| Quick actions | Flow Exploration · Open Tag Tree · Connector Manager · Diagnostics | Shortcuts to the main screens. |
| Recent activity | log feed + all → | The latest events (errors highlighted); all → opens the full Logger. |
The AI Agent panel on the right offers starter prompts on an empty chat. Every frame control (rail, status bar, AI panel) is named in The IDE frame.
Tag Tree
Section titled “Tag Tree”The primary place you author tags and logic — a two-pane view, opened from the rail’s Tag Tree.
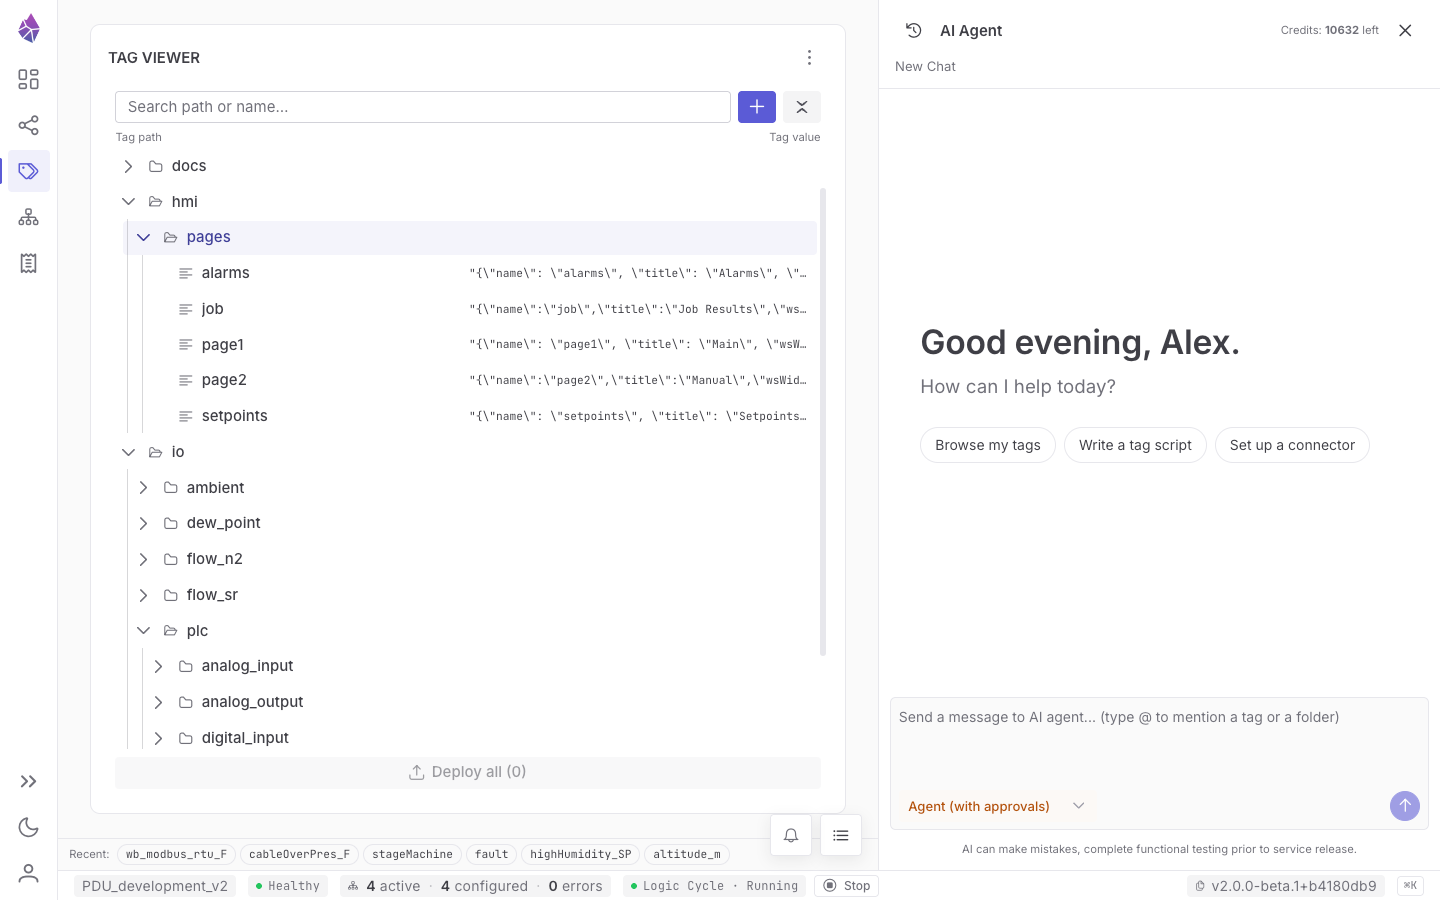
- Left — Tag Viewer. A searchable, VS Code-style tree with recents, multi-select and a right-click menu. Rows carry type icons (folders open/closed; leaves by value type) and a code glyph on scripted tags. The + button adds a tag; Export / Import live in the panel header’s ⋮ menu.
- Right — Properties, with tabs for the selected tag:
- Basic — a status-first layout: a status icon row (plug / role / script), a value card with quality shown as a coloured dot, the path/name id, linked connectors, description, and rename / duplicate / delete.
- Scripting — the logic editor (below).
- Connections — the tag’s place in the dependency graph: upstream (what this tag reads) and downstream (what reads this tag), each clickable to walk the graph.
- Advanced — value rounding (decimal points) and the script’s scheduling settings (Skip-if-already-running, Priority).
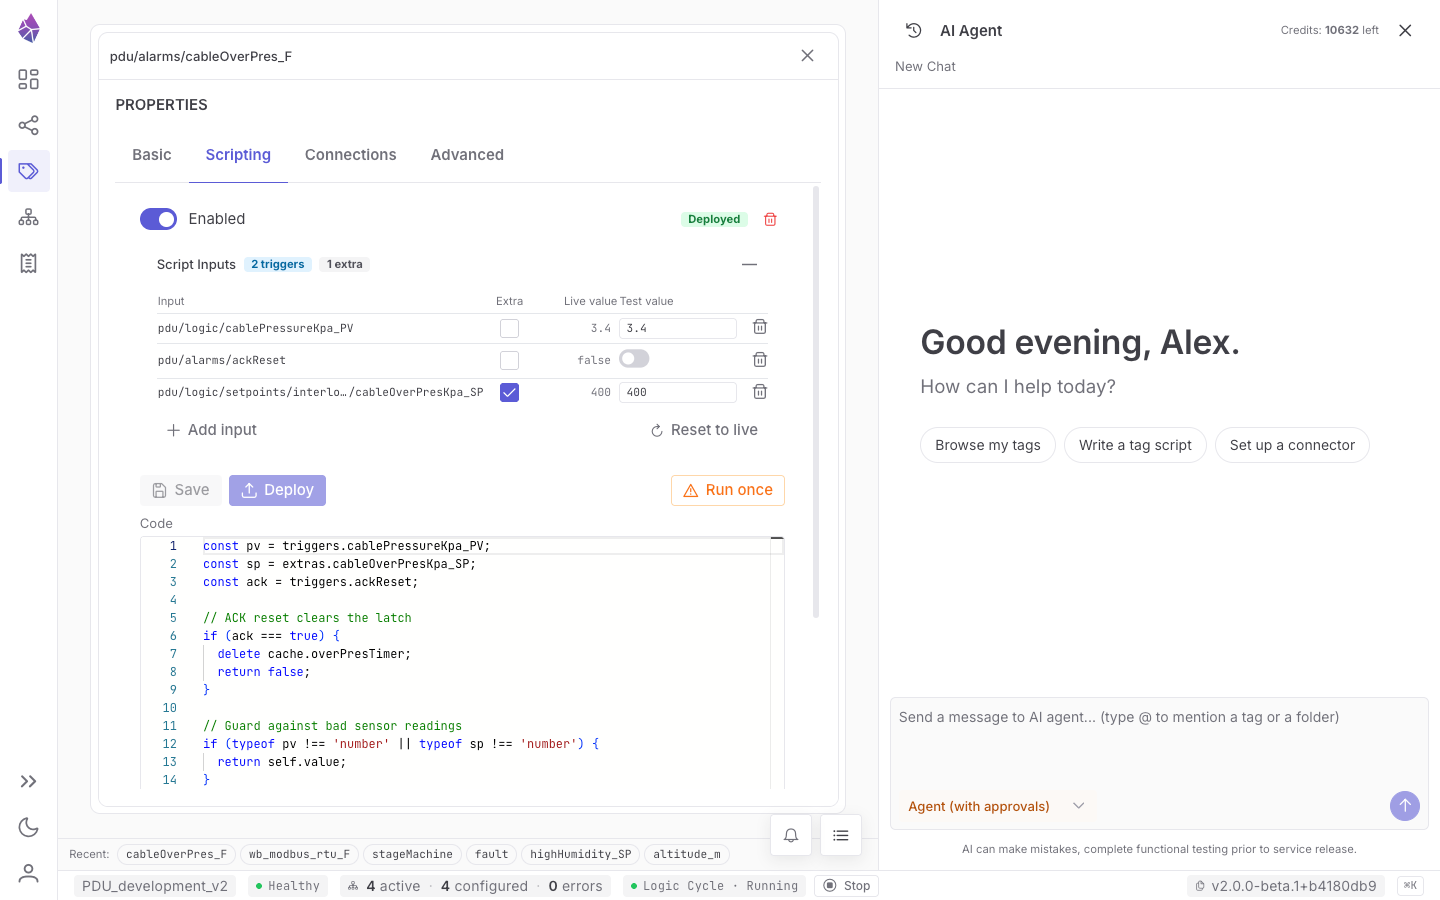
The Scripting tab is the editor for a tag’s logic: a code editor, an Inputs for testing
panel, a Test action that runs the saved script against synthetic values, Save (draft) →
Deploy, and a Run once action. Its inputs are derived from the code — you declare them
by calling on("path/name") (a trigger) and read("path/name") (a read-only input) in the script,
and the panel lists them as you type. Deploying or enabling a script never runs it — it runs on the
next change of an on() tag (or Run once); a script with no on() inputs runs only via Run once.
Live run stats (run count, average time, last error, what triggered the last run) show beneath it. A
coloured dot on the tab flags an undeployed draft or a last-run error.
Opened from the rail’s Flows, the Flow Exploration view is a causal tracer with no real PLC equivalent: pick a signal and expand its upstream causes and downstream effects across the dependency graph. The fastest way to answer “what drives this value, and what does it affect?”
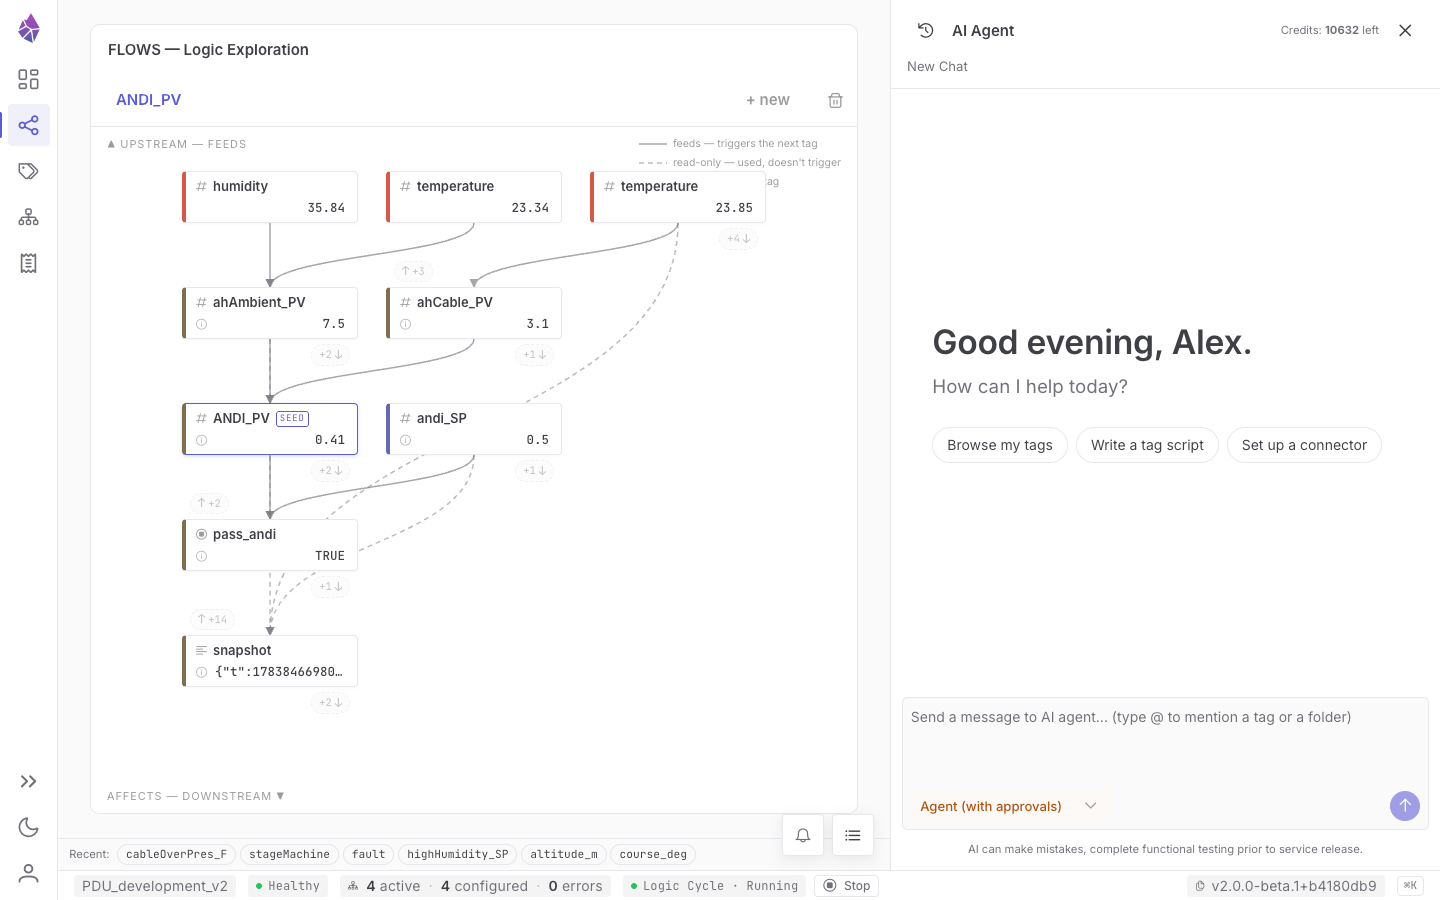
Any tag carrying a script grows a logic strip along the top of its chip, printing that script’s
description — so the flow explains itself instead
of showing a bare graph. A chip with a script but no caption yet reads no description, and a
description whose code has since changed is flagged with a warning-coloured ƒ. The ƒ descriptions pill at the top-right of the canvas hides or shows the strips; it is on by default
and remembers your choice in that browser.
Connector Manager
Section titled “Connector Manager”Install, configure and monitor everything that bridges the node to the field and the cloud.
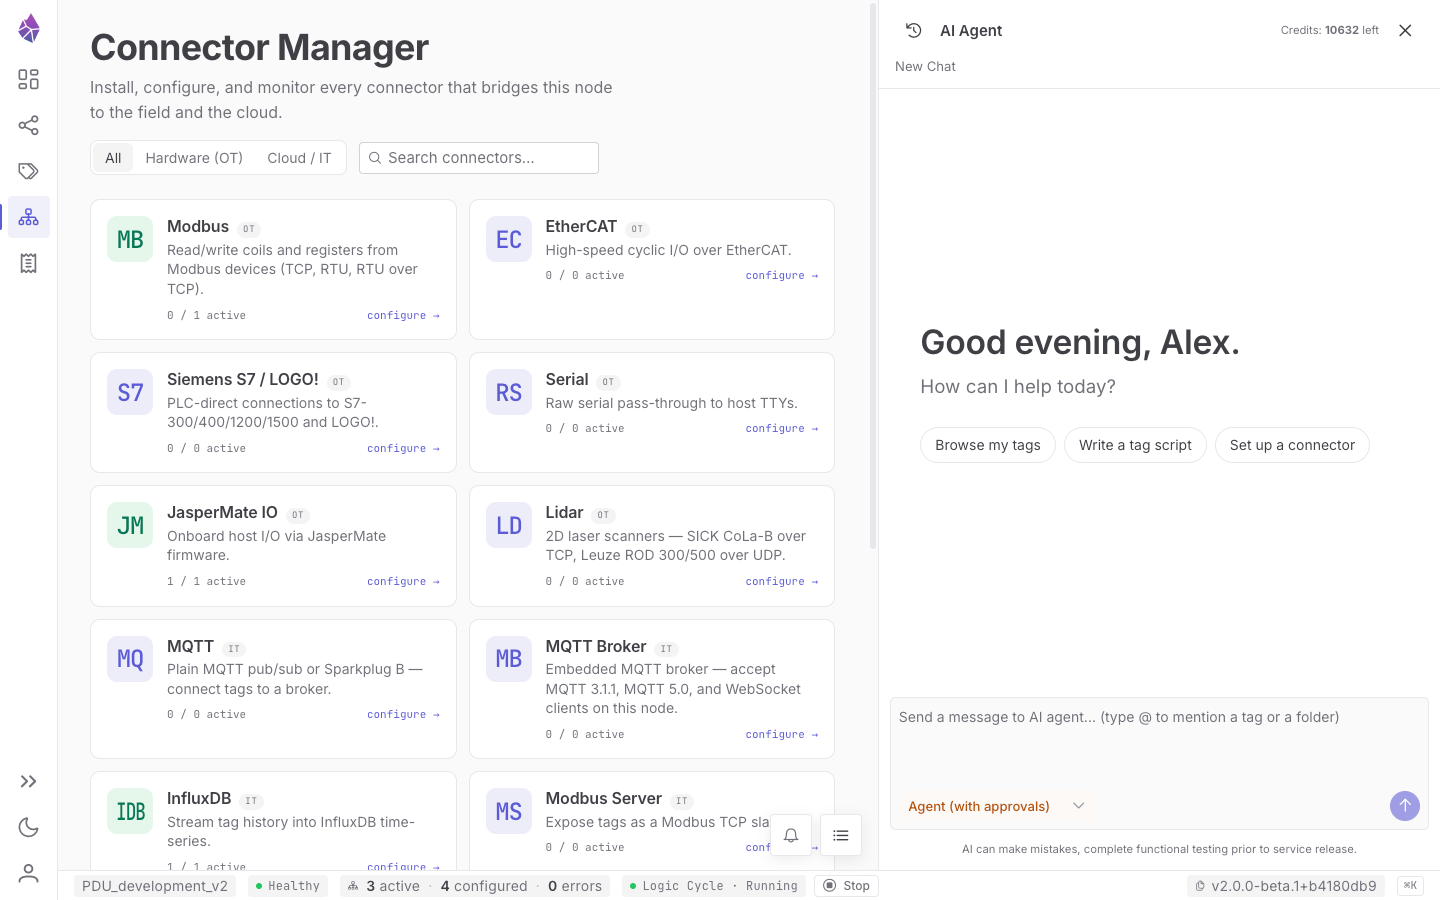
- Connected — every configured instance across all types: name, type, live status pill, latency, an Enabled toggle and Configure.
- Catalogue — the connector types themselves, filterable (All / Hardware (OT) / Cloud / IT). Each tile shows what the connector is for, a state badge (Installed, Built in, Not installed), the pinned version, how many of its instances are active, and either Configure or Install. The ⓘ button opens an About card — when to use it, and what it is doing on this node.
- A freshness row above the tiles reports when the catalogue was last checked, with Check now. Being offline is normal: installed connectors keep working, you just can’t install new ones.
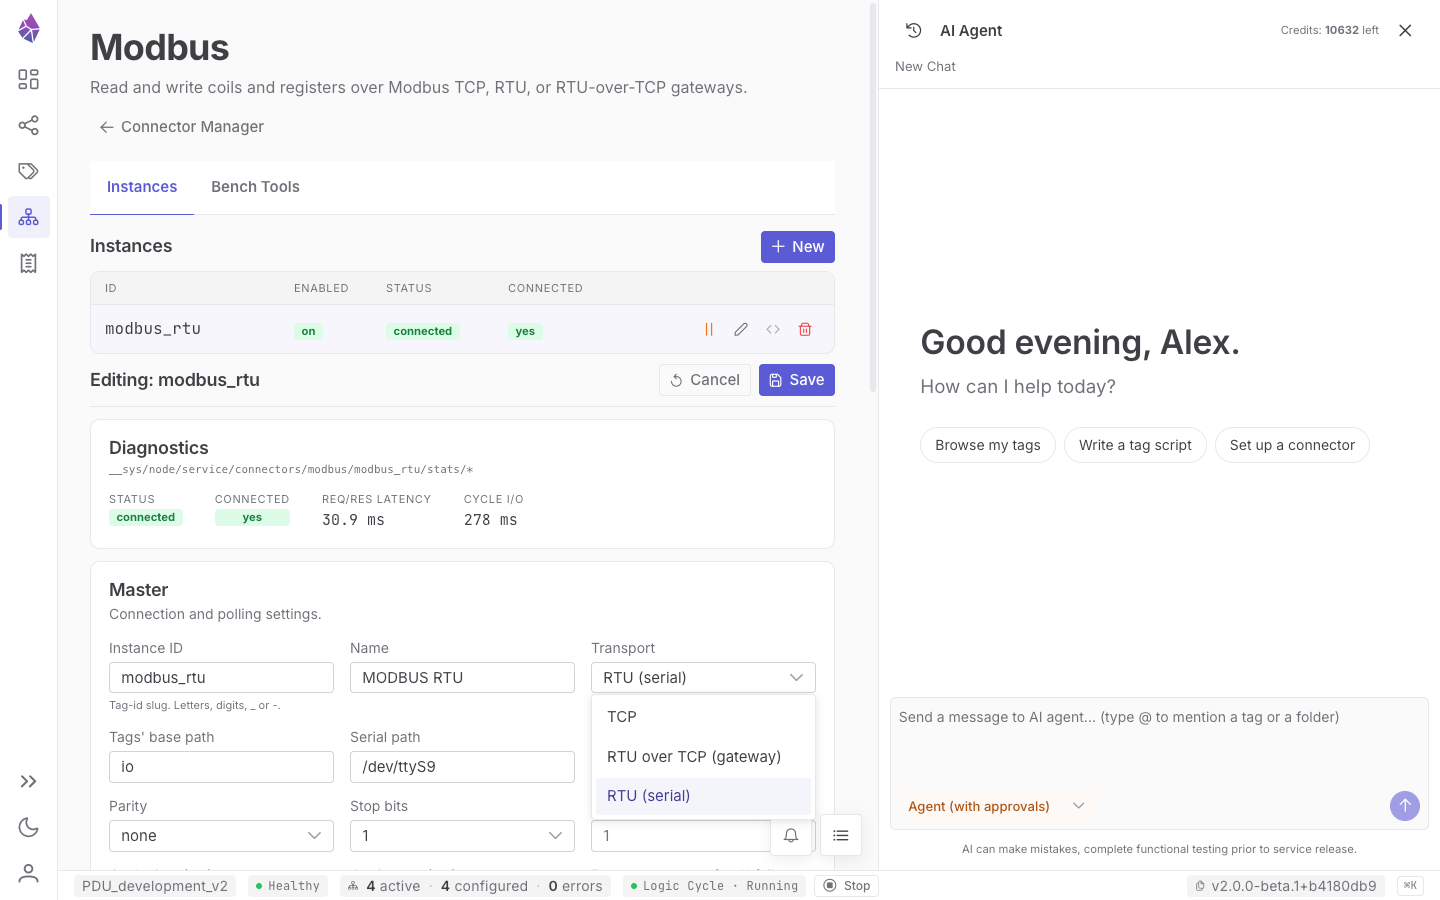
Selecting a type opens its dedicated page (an Instances list plus, for some, Bench Tools). Editing an instance opens the connection settings, the value mapping table, and a live diagnostics panel — see the Modbus example in Connectors.
The AI Agent panel & Deploy Gate
Section titled “The AI Agent panel & Deploy Gate”The right-edge chat is where you work with Jasper, the AI agent. Tool
calls render inline; investigation runs freely, while a process-affecting change appears as a
Deploy Gate card — a proposed-change diff, a test report, and Approve / Reject — that the
agent waits on before the change goes live. Use @ to mention tags in your messages. Jasper can also
answer with a live flow diagram drawn inline in the chat — read-only and disposable, but wired to
the real tags.
Diagnostics
Section titled “Diagnostics”Node health at a glance plus the full log.
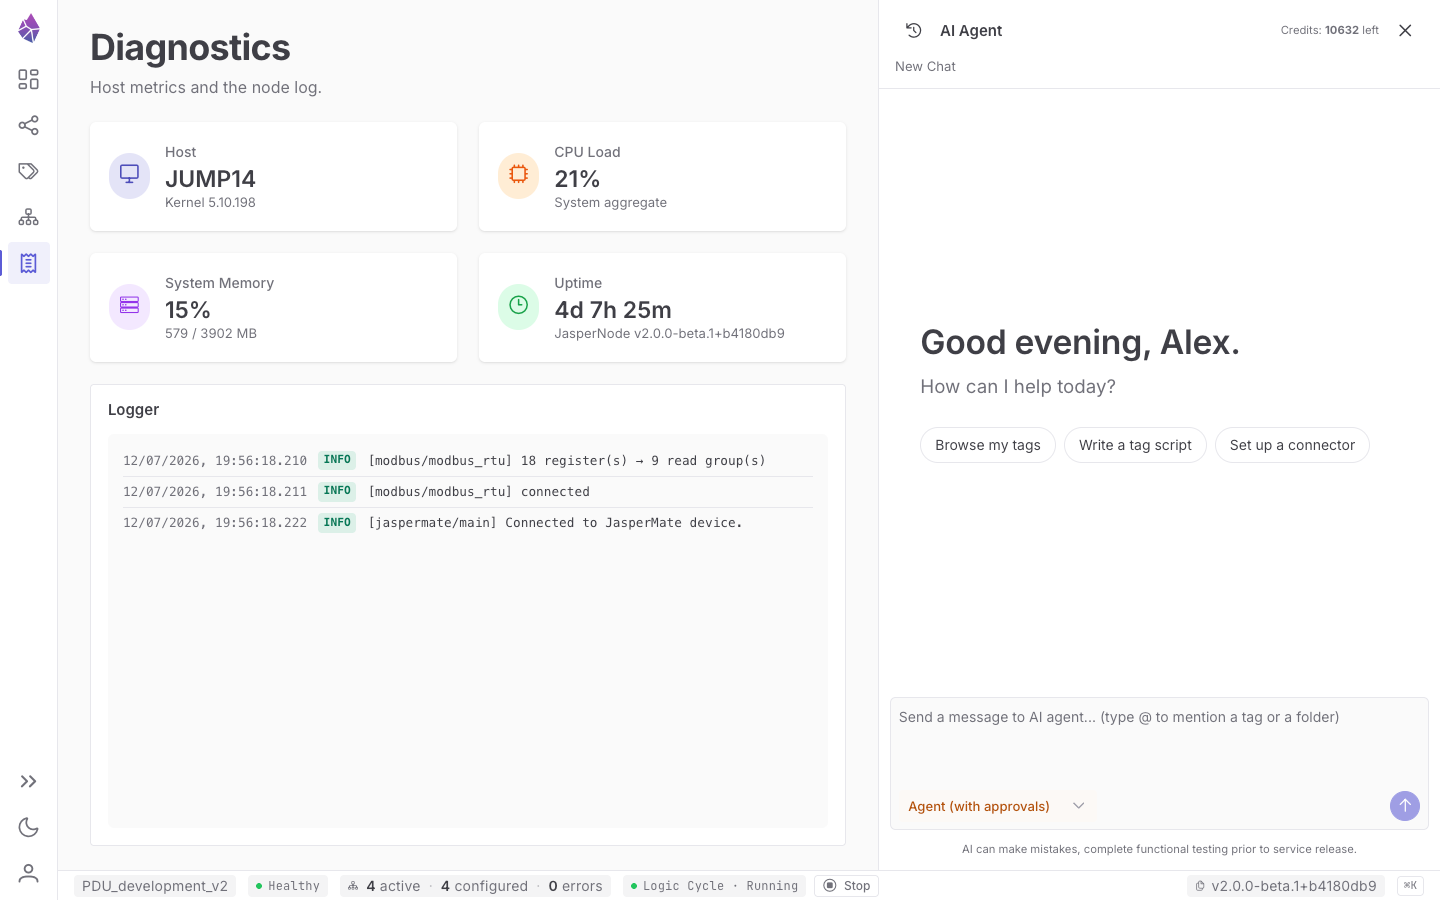
- Host cards — hostname, CPU load, memory, and uptime (sourced from
__sys/host/*). - Logger — the node’s log stream (
info/warning/error), also reachable from the floating Logger drawer on other screens.
Account, settings and theme
Section titled “Account, settings and theme”The account button at the bottom of the rail opens a menu to System Config, Backup & Restore, System Updates, and Report Issue. Beside it, a control toggles dark / light mode. Sign-in itself happens on the Login screen (Login via JasperX), and a brand-new node shows a one-time Setup step first.
Keyboard & tips
Section titled “Keyboard & tips”⌘K/Ctrl+K— focus the AI chat.- The Logic Cycle Stop/Start toggle (status bar) pauses or resumes all scripts; both actions ask for confirmation.
- Status pills are consistent everywhere: Connected (green), Disconnected/Error (red/amber), Stopped (muted).