
Getting started
This guide takes you from a running JasperNode instance to your first piece of working logic and your first field connection. It assumes no prior JasperNode knowledge. If you have never worked with PLCs or industrial I/O, skim JasperNode vs. a traditional PLC and the Glossary alongside it.
What you need
Section titled “What you need”- A JasperNode instance. JasperNode is a runtime you install on a host. See Where JasperNode runs below. For a first look you can also run it on a Linux box or a development machine.
- A modern browser. The entire product is a browser IDE — there is nothing to install on your workstation.
- A JasperX account. Sign-in and the AI agent are provided by the JasperX cloud.
Where JasperNode runs
Section titled “Where JasperNode runs”JasperNode is designed for Linux, from small IIoT gateways up to cloud servers. The typical target is a 4-core / 4 GB ARM edge device; the practical minimum is 2 cores and 2 GB of RAM on a trimmed, headless Linux OS.
The supported production target. Install the JasperNode binary on the host and run it as a service. All connectors — including serial and EtherCAT, which need direct hardware and predictable latency — work natively here. The installer sets up a systemd service — during the beta, install from the beta channel:
curl -sSL https://dl2.jasperx.io/jn/install.sh | JN_CHANNEL=beta sudo -E bash -Ask for the connectors you need with CNTR=. The runtime ships without connectors — each
one is downloaded from JasperNode’s signed connector catalogue, so a connector can be updated
without updating the node. Name the ones this node needs and it installs them itself as it
starts, so the node comes up already holding them:
curl -sSL https://dl2.jasperx.io/jn/install.sh | JN_CHANNEL=beta CNTR=modbus,s7 sudo -E bash -Names are the connector type slugs — modbus, s7, serial, ethercat, jaspermate,
lidar, mqtt, mqtt_broker, modbus_server, hmi, influxdb (see the
Connector catalog). A name the catalogue does not have stops
the installer, which lists the ones it does have; nothing is installed until you re-run with it
corrected.
CNTR= is optional and only a starting point — you can add or remove connectors at any time in
the Connector Manager, and re-running the installer with CNTR= on an up-to-date node adds
them without touching the binary.
There is no native macOS build. Run JasperNode inside a Linux container with Docker or
Podman — pull the jaspernode/jaspernode image (:latest-beta follows the beta channel):
docker run -d --name jaspernode -p 9009:9009 \ -v jaspernode-data:/var/lib/jaspernode \ jaspernode/jaspernode:latest-betaNetwork connectors (Modbus TCP, MQTT, S7 over Ethernet, InfluxDB, Modbus Server) reach peers over your LAN exactly as they would natively.
Hardware-attached connectors need extra host setup:
- Serial / Modbus RTU — bridge the port over TCP on the host (e.g.
socat) or use a network-serial gateway (MOXA NPort, Digi PortServer) and connect over the LAN. - EtherCAT — not supported on a macOS host; the container virtualisation layer breaks the raw-socket timing it needs. Deploy to Linux hardware for EtherCAT.
Network diagnostic tools — ARP scan, ping, traceroute, MTR, packet sniff, LLDP
discover/send, Profinet DCP identify/get — work out of the box. They need raw network access,
so the container starts up, hands itself that one capability (CAP_NET_RAW) and immediately
drops to the unprivileged jaspernode user, exactly as the native Linux systemd service does.
JasperNode itself never runs as root.
If you harden the container with --cap-drop, name the user as well, or it cannot make the
switch and will refuse to start:
docker run -d --name jaspernode -p 9009:9009 \ --cap-drop=ALL --user 1000:1000 \ -v jaspernode-data:/var/lib/jaspernode \ jaspernode/jaspernode:latest-betaThat run has no raw network access, so those tools report themselves unavailable and the node
flags it on the __sys/host/network/prerequisites tag. Everything else — port check,
bandwidth, DNS, WHOIS, web check, the interface list and every protocol connector — is
unaffected.
There is no native Windows build. Run JasperNode inside a Linux container with Docker
Desktop (WSL2 backend) or Podman — pull the jaspernode/jaspernode image (:latest-beta
follows the beta channel):
docker run -d --name jaspernode -p 9009:9009 ` -v jaspernode-data:/var/lib/jaspernode ` jaspernode/jaspernode:latest-betaNetwork connectors (Modbus TCP, MQTT, S7 over Ethernet, InfluxDB, Modbus Server) reach peers over your LAN exactly as they would natively.
Hardware-attached connectors need extra host setup:
- Serial / Modbus RTU — pass a USB-serial adapter into WSL2 with
usbipd-win, or use a network-serial gateway (MOXA NPort, Digi PortServer) and connect over the LAN. - EtherCAT — not supported on a Windows host; the container virtualisation layer breaks the raw-socket timing it needs. Deploy to Linux hardware for EtherCAT.
Network diagnostic tools — ARP scan, ping, traceroute, MTR, packet sniff, LLDP
discover/send, Profinet DCP identify/get — work out of the box. They need raw network access,
so the container starts up, hands itself that one capability (CAP_NET_RAW) and immediately
drops to the unprivileged jaspernode user, exactly as the native Linux systemd service does.
JasperNode itself never runs as root.
If you harden the container with --cap-drop, name the user as well, or it cannot make the
switch and will refuse to start:
docker run -d --name jaspernode -p 9009:9009 ` --cap-drop=ALL --user 1000:1000 ` -v jaspernode-data:/var/lib/jaspernode ` jaspernode/jaspernode:latest-betaThat run has no raw network access, so those tools report themselves unavailable and the node
flags it on the __sys/host/network/prerequisites tag. Everything else — port check,
bandwidth, DNS, WHOIS, web check, the interface list and every protocol connector — is
unaffected.
Updating later: a native Linux install updates itself on its release channel, while a container node is updated from the host by pulling the newer image and recreating the container — see Software updates and Updating a container node.
Open the IDE and sign in
Section titled “Open the IDE and sign in”-
Point your browser at the node. By default the runtime serves the IDE on its HTTP port. On the same machine that is
http://localhost:9009; on a device, use the device’s address. -
Complete first-run setup. A new node shows a short Setup screen to establish node identity before anything else can be edited.
-
Sign in with JasperX. Authentication is delegated to the JasperX cloud — there are no local user accounts. Click Login via JasperX and authorise. The first editor to register a node becomes its owner and can invite others.
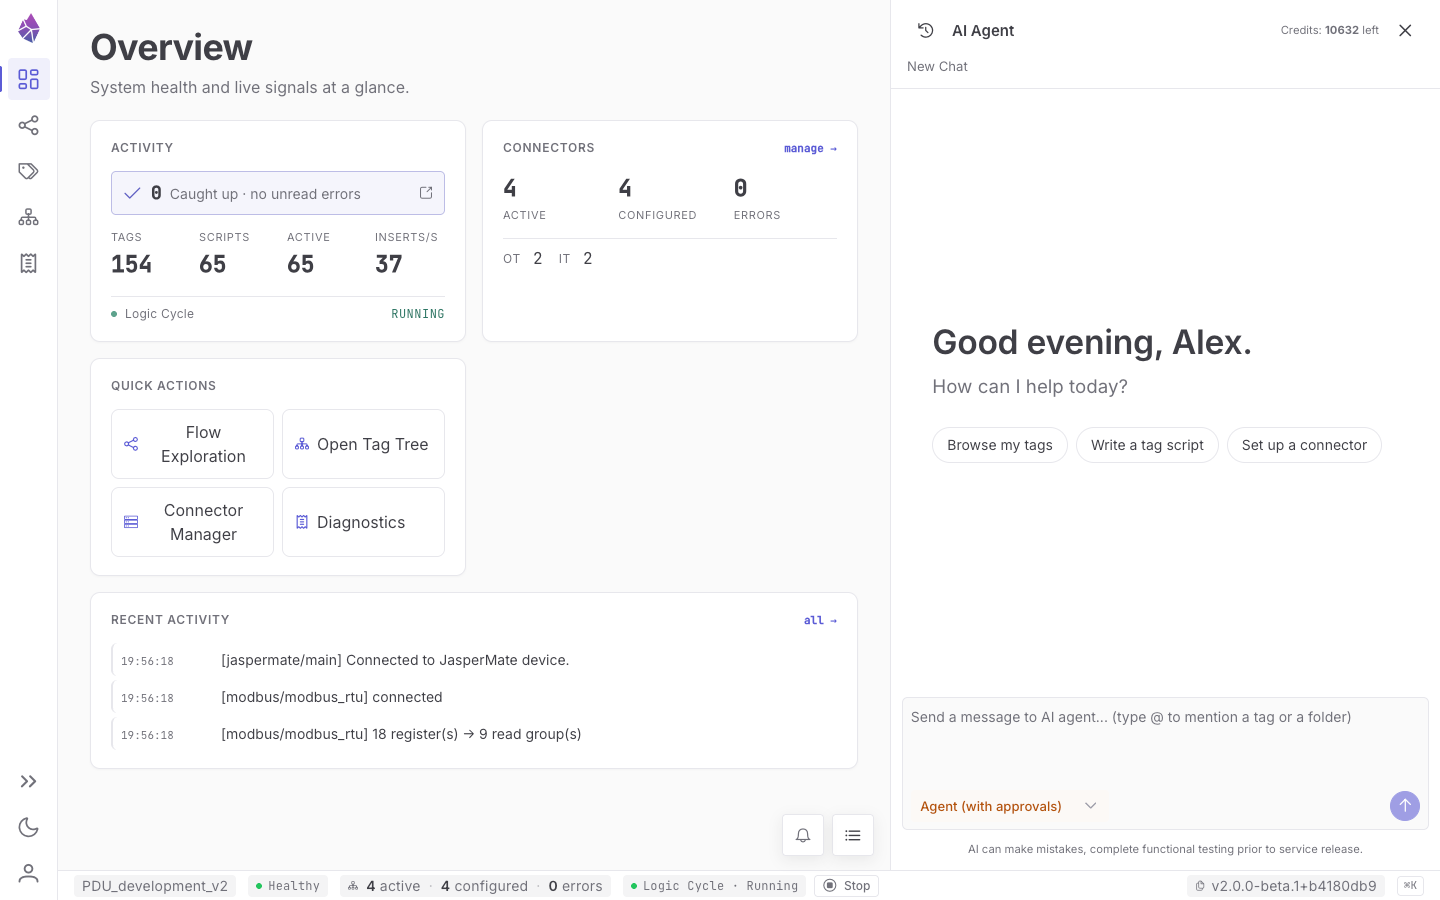
After sign-in you land on the Overview dashboard: tag and script counts, connector health, the Logic Cycle run state, and recent activity.
Build your first logic
Section titled “Build your first logic”Let’s create a tag that counts once per second — the “blink an LED” of JasperNode. It shows the three things that make the system tick: tags, triggers, and reactive scripts.
-
Open the Tag Tree. In the left icon rail choose Tag Tree.
-
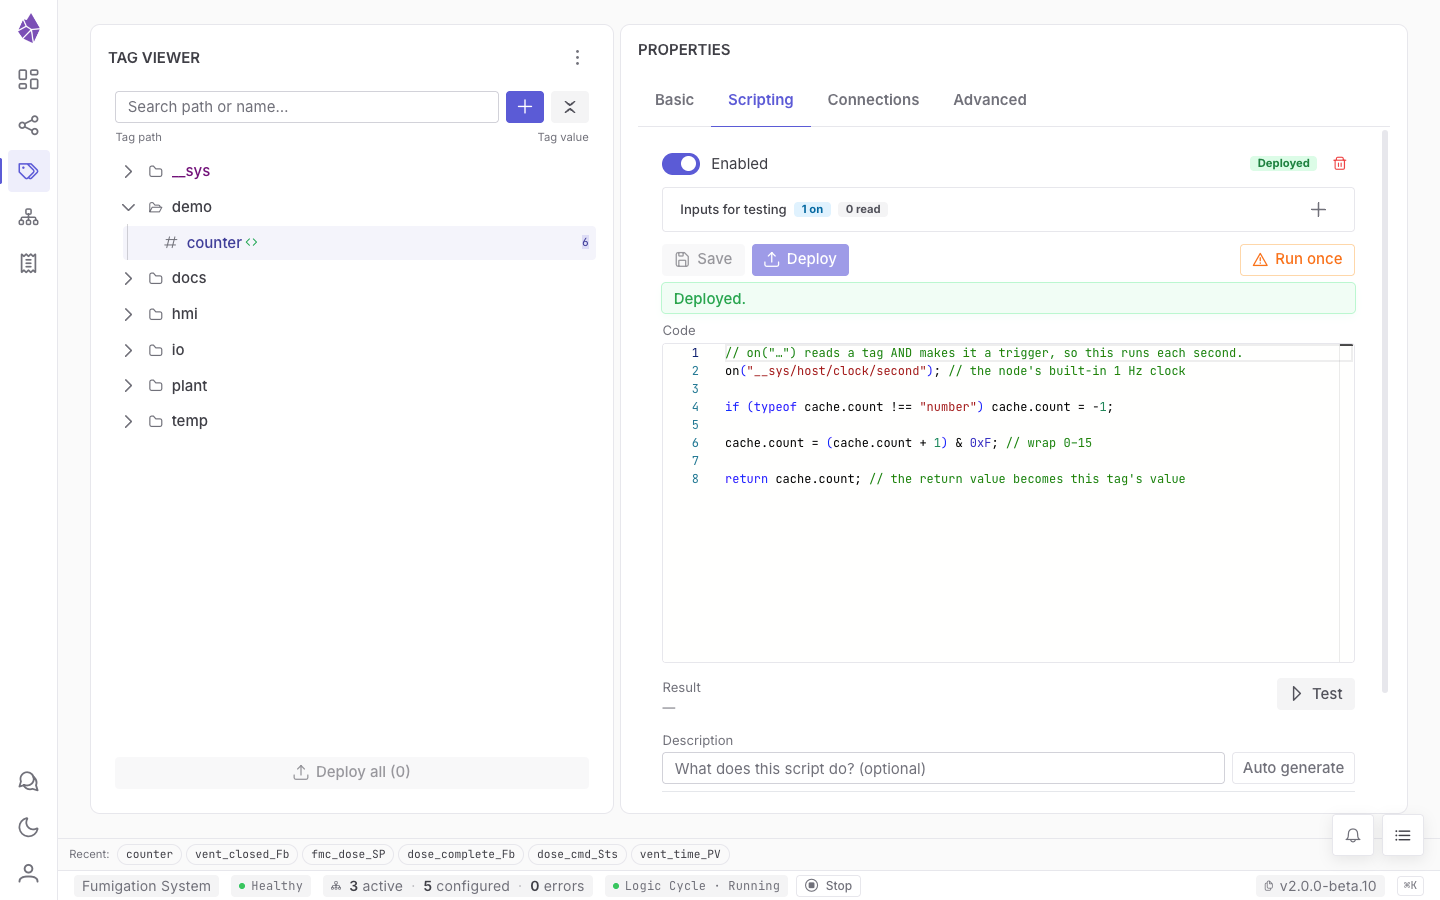
Create a tag. Click the + button above the tree. Create a tag named
counterunder a new path such asdemo/, with value type number. You now havedemo/counterin the tree. -
Attach a script. Select
demo/counter, open the Scripting tab, and turn the script Enabled switch on. In the editor, write:// on("…") reads a tag AND makes it a trigger, so this runs each second.on("__sys/host/clock/second"); // the node's built-in 1 Hz clockif (typeof cache.count !== "number") cache.count = -1;cache.count = (cache.count + 1) & 0xF; // wrap 0–15return cache.count; // the return value becomes this tag's valueYou don’t add triggers anywhere else — calling
on("__sys/host/clock/second")in the code is how you declare it. The Inputs for testing panel above the editor updates to list it as you type. (Tip: instead of typing an id, drag a tag from the tree into the editor — it drops in ason("…"); the editor also autocompletes ids insideon(/read(.) -
Deploy. Click Deploy. The script flips live atomically and
demo/counterstarts counting 0→15 and wrapping, once per second.
What just happened, in JasperNode terms:
- The script belongs to
demo/counterand may only set its own value (viareturnorself.setValue(...)). - It runs only when
__sys/host/clock/secondchanges — declared by theon(...)call, not on a fixed scan. cacheis a per-script object that persists between runs, so the count carries over.
See Logic & the Logic Cycle for the full execution model, the
self / on / read / fn APIs, and how to chain tags together.
Connect to a device
Section titled “Connect to a device”Logic is more useful when it reads real I/O. Connectors bridge the tag tree to the field. Here is a Modbus TCP example; every connector follows the same configure → enable pattern.
-
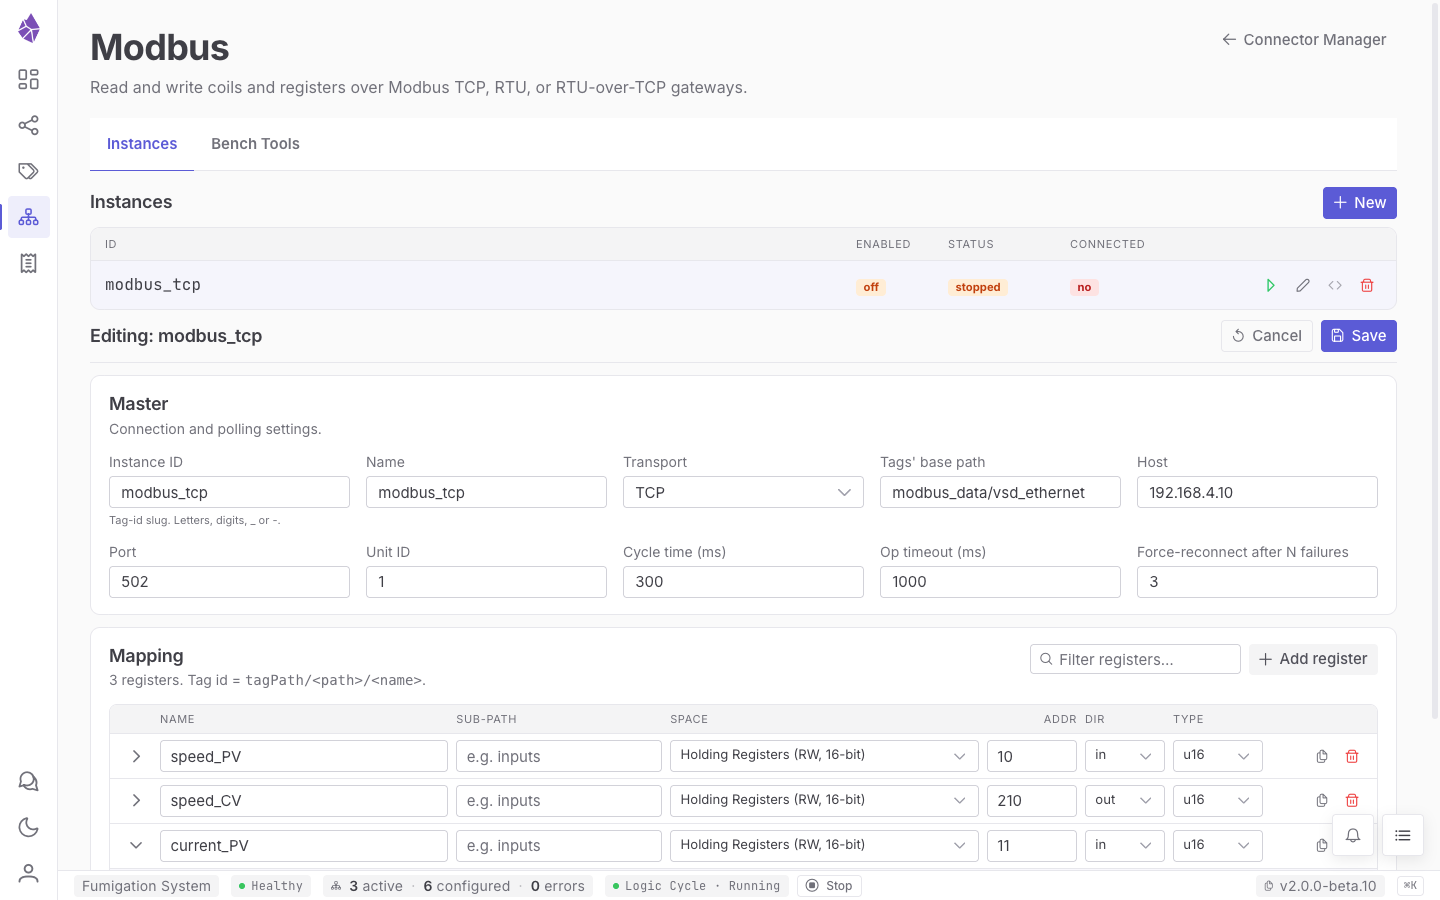
Open the Connector Manager from the left rail, choose Modbus, and click + New.
-
Fill in the master. Set the transport (TCP), Host and Port (e.g.
502), the Unit ID, a Cycle time (how often to poll, in ms), and a Tags’ base path — the folder the connector’s tags are created under, e.g.modbus_data/vsd_ethernet. -
Map registers. Add one row per value. For each: a name, the register space (e.g. Holding Registers), the address, a direction (
in= device→tag,out= tag→device), and a data type (e.g.u16). -
Save, then enable. Saving stores the configuration; the Enabled toggle starts the connector. Only an enabled connector touches the wire.
-
Watch the tags. The mapped tags appear under your base path in the Tag Tree and update every cycle. The connector’s live status and latency show on its page and in the status bar.
Ask the AI agent
Section titled “Ask the AI agent”The AI Agent panel sits on the right edge of the IDE (toggle it from the rail, or press
⌘K / Ctrl+K). Describe what you want in plain language — “create a high-temperature alarm on
demo/counter over 12”, “set up an MQTT connection to my broker”, “why is bench_s71200
disconnected?”. You can reference tags with @ mentions.
The agent reads the tree and proposes changes. Anything that would alter the running process is held at the Deploy Gate: the agent tests the change and waits for your Approve / Reject before it takes effect. Read-only investigation needs no approval. See The AI agent & Deploy Gate.