Tag & logic screens
The Tag Tree (left rail) is where you author tags and logic, and its sibling Flows traces how they connect. The Tag Tree is the one you’ll use most. This page names every control on both. For the concepts behind tags and scripts, see Everything is a tag and Logic & the Logic Cycle.
The two tag screens
Section titled “The two tag screens”| Screen | What it is |
|---|---|
| Tag Tree | The two-pane tag browser and editor (below). |
| Flows | A causal tracer — pick a signal and expand its upstream causes and downstream effects. |
Tag Tree — the Tag Viewer (left pane)
Section titled “Tag Tree — the Tag Viewer (left pane)”| Control | What it is |
|---|---|
| Search path or name… | Filters the tree by path or tag name. |
| Recent chips | Recently opened tags — click to jump back. |
| Add tag (+) | Creates a new tag (you choose its path, name and value type). |
| Collapse all folders | Collapses the whole tree. |
| More actions (⋮) | In the panel header: Export tags (save a subtree to a file) and Import tags (load tags from a file). |
| Tag path / Tag value columns | The tree itself. Each row carries a type icon — folders show an open/closed folder glyph; leaves show their value type (number, boolean, text, bytes) — and tags with a script also show a code glyph (green = enabled, orange = disabled). Faint vertical indent guides mark each level. Single-click a folder (or its caret) to expand/collapse and deep-link it, VS Code-style; each tag shows its live value on the right. Click a tag to load it into Properties; right-click for a context menu; Ctrl-click for multi-select. |
Tag Tree — Properties (right pane)
Section titled “Tag Tree — Properties (right pane)”Selecting a tag fills the Properties pane, which has four tabs: Basic, Scripting, Connections, Advanced.
Basic tab
Section titled “Basic tab”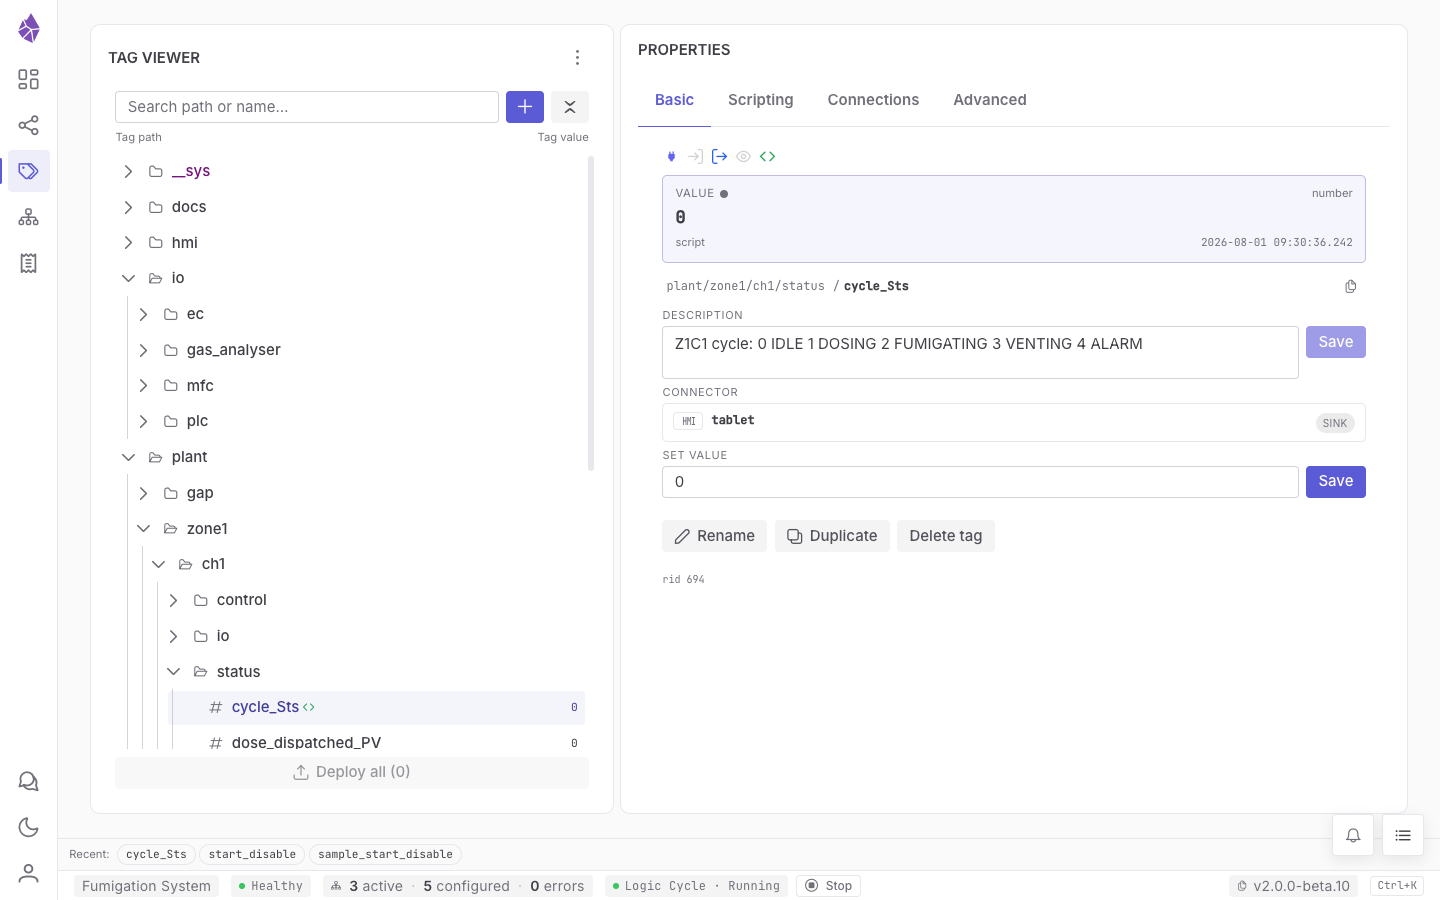
The Basic tab is a status-first layout: a row of status icons up top, then a value card, the id, and the tag’s connector links.
| Element | What it is |
|---|---|
| Status icon row | At-a-glance state — plug (linked to a field connector), writer / sink / reader (role), and script (green = enabled, orange = disabled). Icons grey out when they don’t apply. |
| Value card | The tag’s current value, with quality shown as a coloured dot beside it (tooltip: good, stale, uncertain, unknown). The card’s head/foot show the value type, the source that last set it (script, system, a connector, ui) and the timestamp of that write. |
| path / name (with copy) | A single id row — clicking the path segment copies the path; the trailing button copies the full tag id. |
| Description (+ Save) | Free-text description; Save writes it. |
| Connector | The bound field connector(s) — monogram, type, id and role badge (WRITER / SINK / READER), or Not linked to a connector. Only IT/OT field connectors are listed (script and system pseudo-connectors are filtered out); a row links straight to that connector’s page. |
| Set value (+ Save) | Writes a value to the tag by hand. Booleans pick true / false from a selector; other types take a text field (a text tag also offers a pop-out editor for multiline / JSON). Nothing is written until you press Save. |
| Rename | Change the tag’s path/name (its durable id is preserved). Scripts reference tags by path, so any script that reads the old id would halt until redeployed — the Rename dialog lists those dependents and, where supported, offers to update and redeploy them in the same step. |
| Duplicate | Create a copy. |
| Delete tag | Remove the tag (blocked, with a prompt, if other tags subscribe to it). |
| rid | The tag’s durable internal identity. |
On a system-managed path (anything under __sys/) the tab opens with a Read-only —
system-managed path notice and the editable controls greyed out: those values come from the engine
and its connectors, not from you. See Everything is a tag.
Scripting tab
Section titled “Scripting tab”The editor for the tag’s logic.
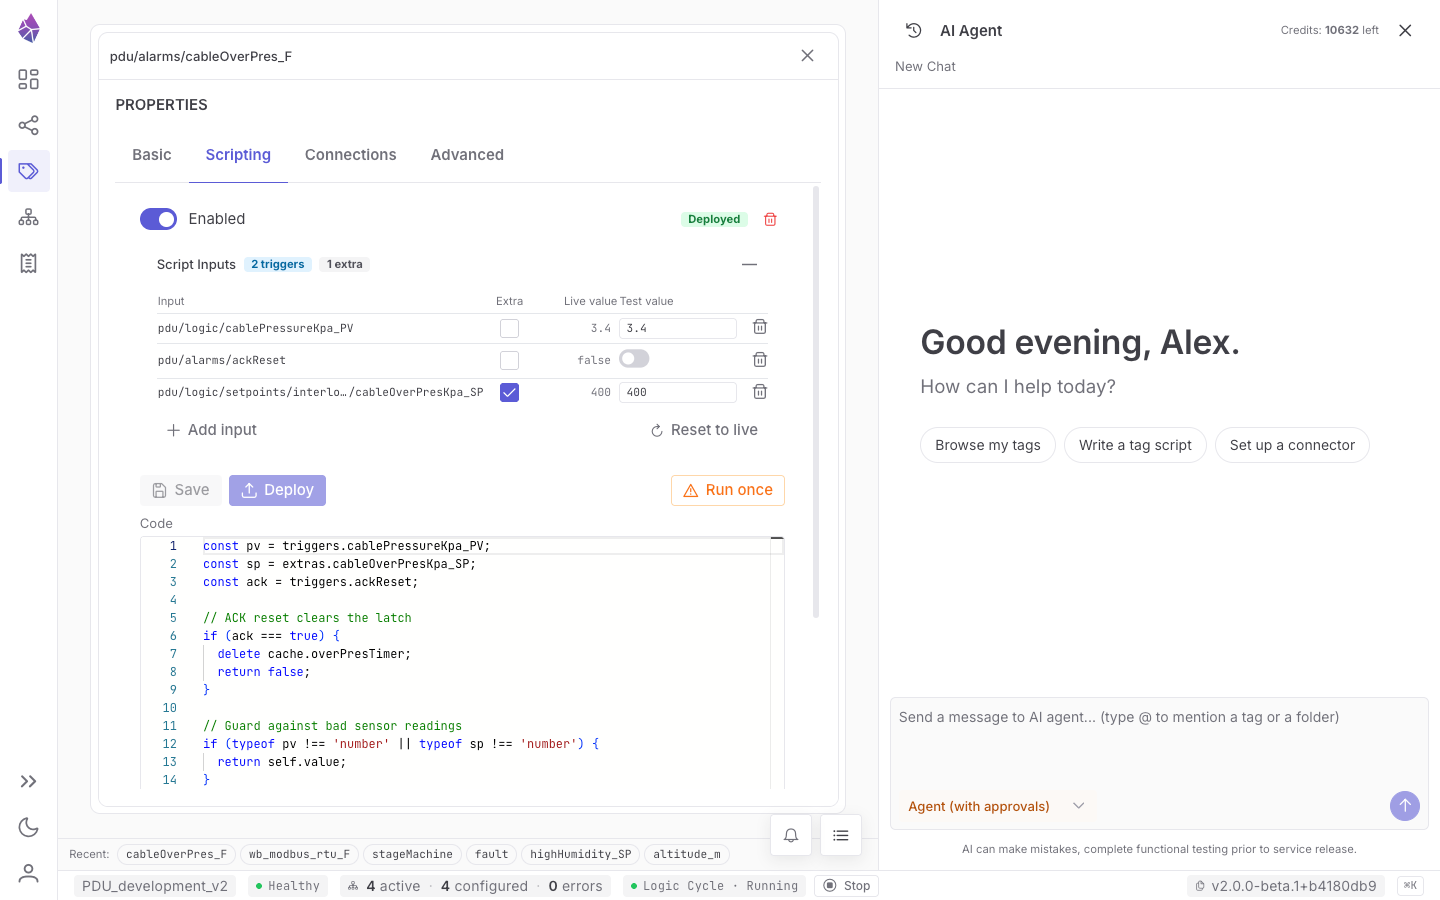
You don’t maintain a trigger or extra list here — a script declares the tags it reads in the
code, by calling on("path/name") (which also makes that tag a trigger) and read("path/name")
(a read-only input). The Inputs for testing panel derives from those calls automatically.
| Control | What it is |
|---|---|
| Enabled toggle | Turns the script on or off. |
| Deployed / draft badge | Shows whether the live script matches the editor (a draft means unsaved/undeployed edits). |
| Delete (script) | Removes the script from the tag. |
| Code editor | The script body (a full code editor with highlighting and tag-id autocomplete). Drag a tag from the tree into the editor to insert on("…") at the drop point (drop it inside an existing on(/read( to fill just the id). |
| Save | Saves your edits as a draft (not yet live). |
| Deploy | Makes the saved script live (atomically). Deploying or enabling a script does not run it — it runs on the next change of an on() tag (or Run once). A script with no on() inputs runs only via Run once. |
| Run once | Executes the deployed script a single time, by hand, against live values — for a one-off recompute or a quick check. A green tick / red flag flashes on the button with the result. |
| Inputs for testing (Input / Kind / Live value / Test value) | The tags the script reads, read from its code — each shown as on (triggers) or read (read-only), with its live value and a synthetic test value. The header counts them (9 on / 1 read) and collapses the panel; the list itself is derived — edit on() / read() in the code to change it. A declared path with no matching tag is flagged unresolved, and Deploy rejects it. |
| Test | Runs the saved script against the test values without deploying — the live process is untouched. |
| Reset to live | Loads current live values back into the test inputs. |
| Description (+ Auto generate) | A one-line caption of what the script does (max 120 chars), shown on the tag’s chip in Flow Exploration. Appears once a script is deployed; saves on Enter or when you click away — no Save button. Optional; it never blocks Deploy. |
outdated badge (beside Description) | The code changed after the description was written, so the sentence may no longer be true. Edit the text or press Auto generate to clear it. Auto generate writes the caption from the deployed code — local and offline, not the AI. |
| Average run time / Times run / Returned a value / Currently running / Triggered by | Live run statistics for the script. |
Skip-if-already-running and Priority are run-time settings — they live on the Advanced tab, not here.
Connections tab
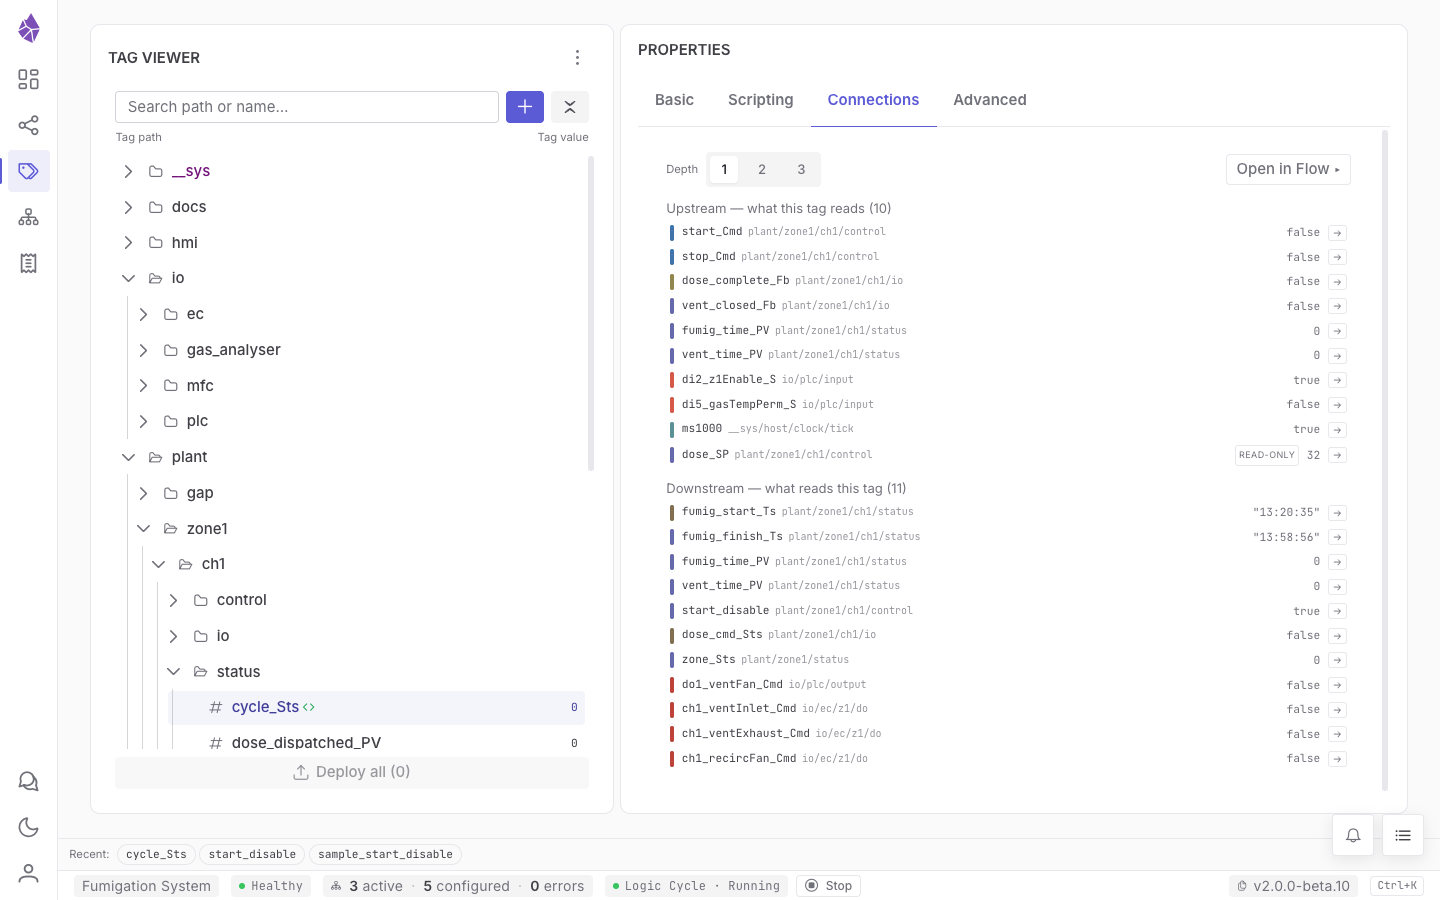
Section titled “Connections tab”A read-only view of the tag’s place in the dependency graph.
| Section | What it shows |
|---|---|
| Upstream | What this tag reads — the tags its script calls on() / read() on, each with its live value. A read-only badge marks inputs that don’t trigger it. |
| Downstream | What reads this tag — the tags whose scripts depend on this one, with live values (the downstream side of the chain). |
| Depth 1 / 2 / 3 | How many hops of the graph to unfold in each direction. |
| Open in Flow | Seeds a Flow Exploration view starting from this tag. |
Advanced tab
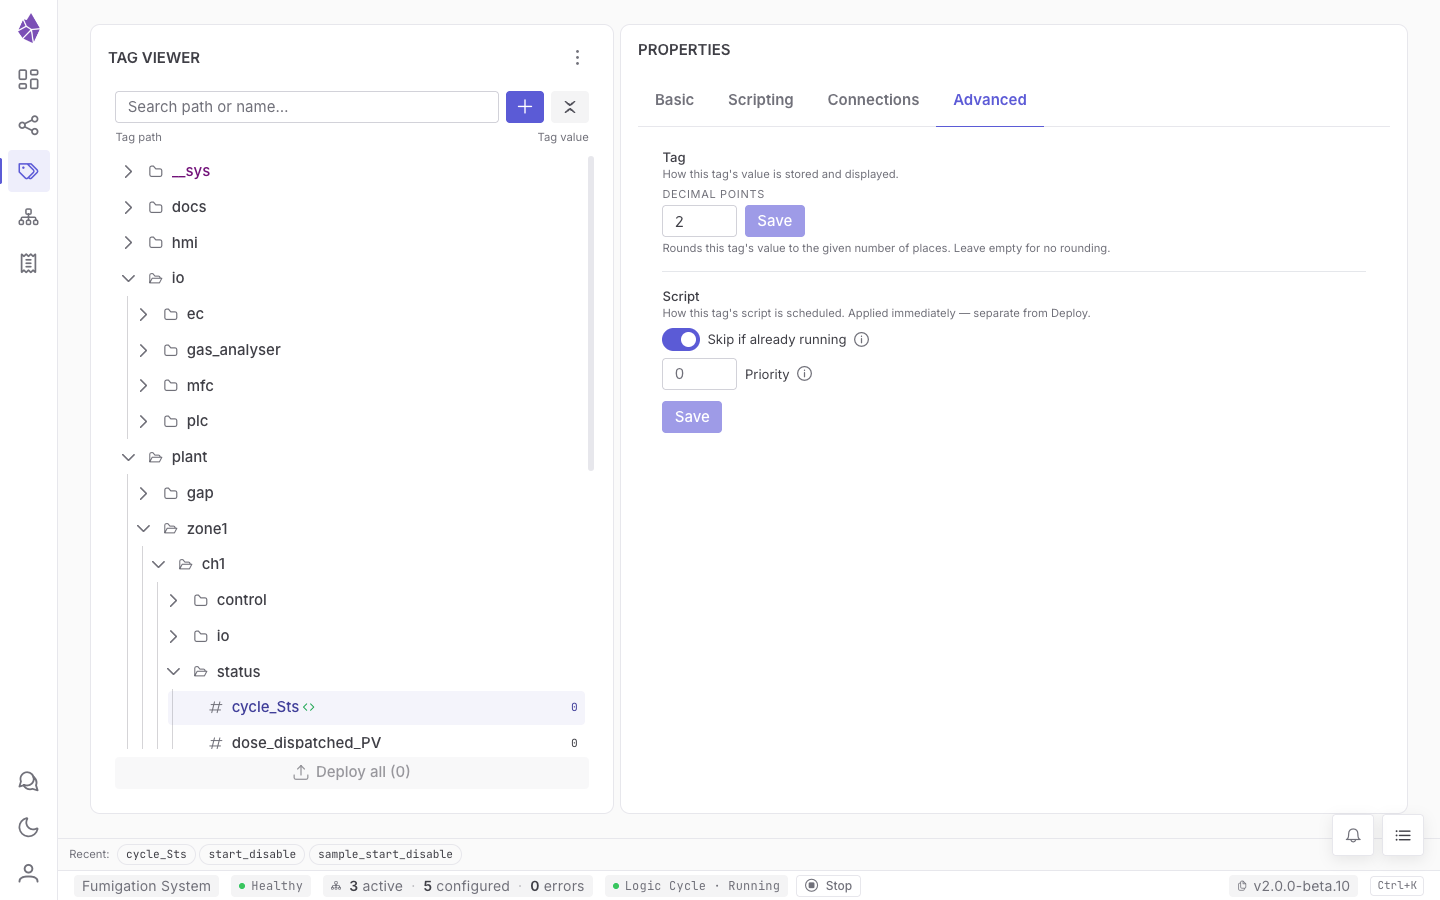
Section titled “Advanced tab”Two settings that don’t belong to the value or the code: how the value is rounded, and how the script is scheduled.
| Control | What it is |
|---|---|
| Decimal points (+ Save) | Rounds this tag’s value to the given number of places. Leave it empty for no rounding. New number tags inherit the node default set in System Config. |
| Skip if already running | When the script is still executing and a trigger fires again, drop the new run instead of queuing it. Use it for long-running scripts that would otherwise back up. |
| Priority | Execution order within a Logic Cycle drain. Lower runs first; default 0. Negative values push critical scripts ahead, positive ones demote audit / logging work. |
Both script settings apply immediately on Save — they are scheduling, not code, so they don’t go through Deploy.
Flow Exploration
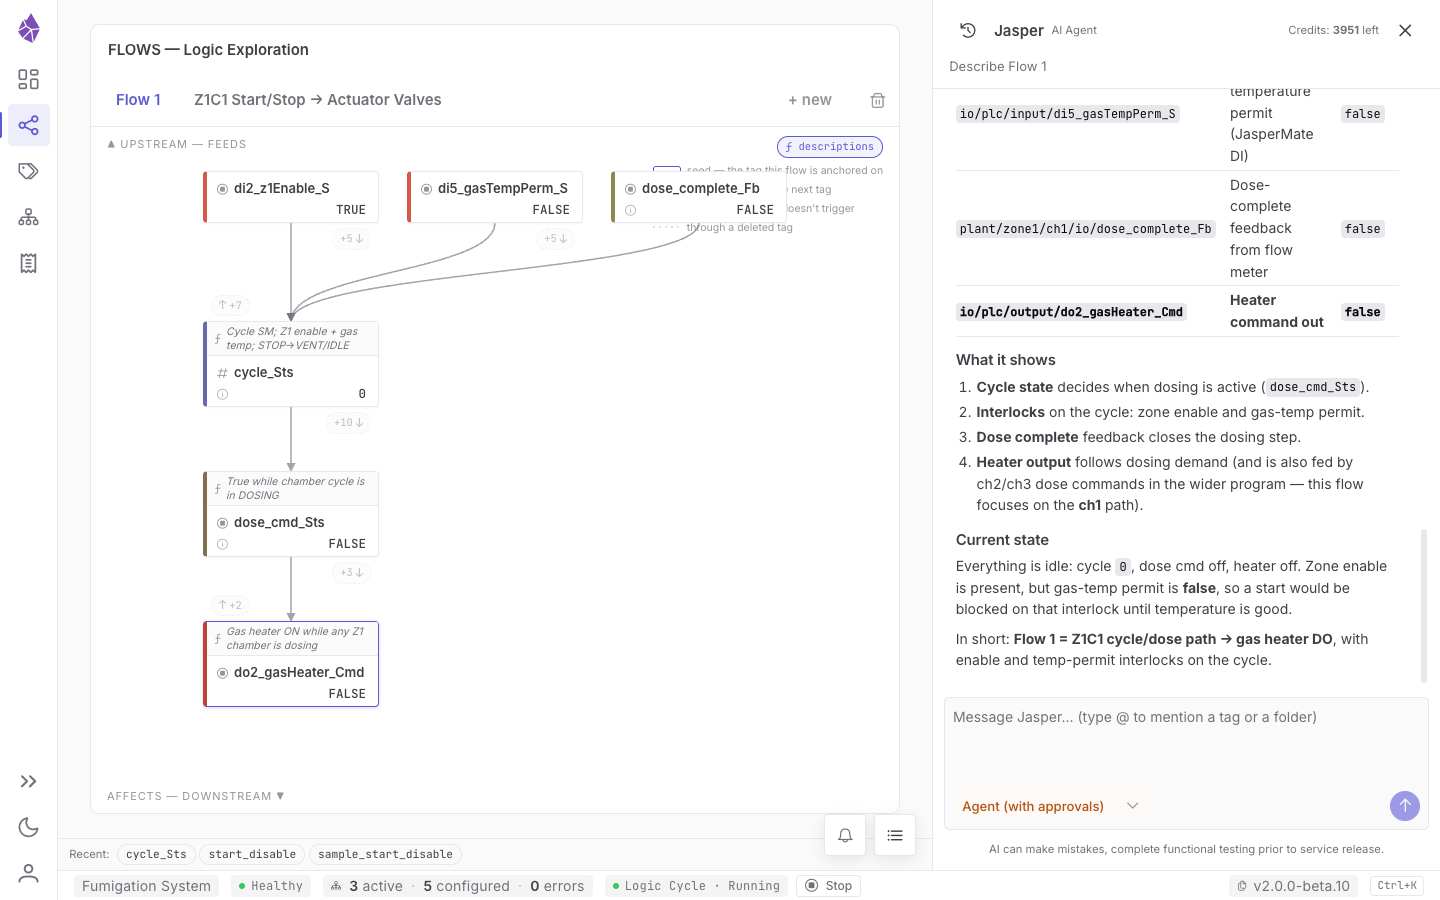
Section titled “Flow Exploration”Flow Exploration answers “what drives this value, and what does it affect?” — choose a signal and walk its causes and effects across the graph. It is a read-only exploration view built on the same dependency graph the Connections tab uses.
In Flow Exploration, a tag that carries a script shows that script’s
description in a logic strip across the top of
its chip, so you can read what each step does without opening it. Toggle the strips with the
ƒ descriptions pill at the top-right of the canvas (on by default, remembered per browser).
Jasper can also draw one of these flows directly in the chat.
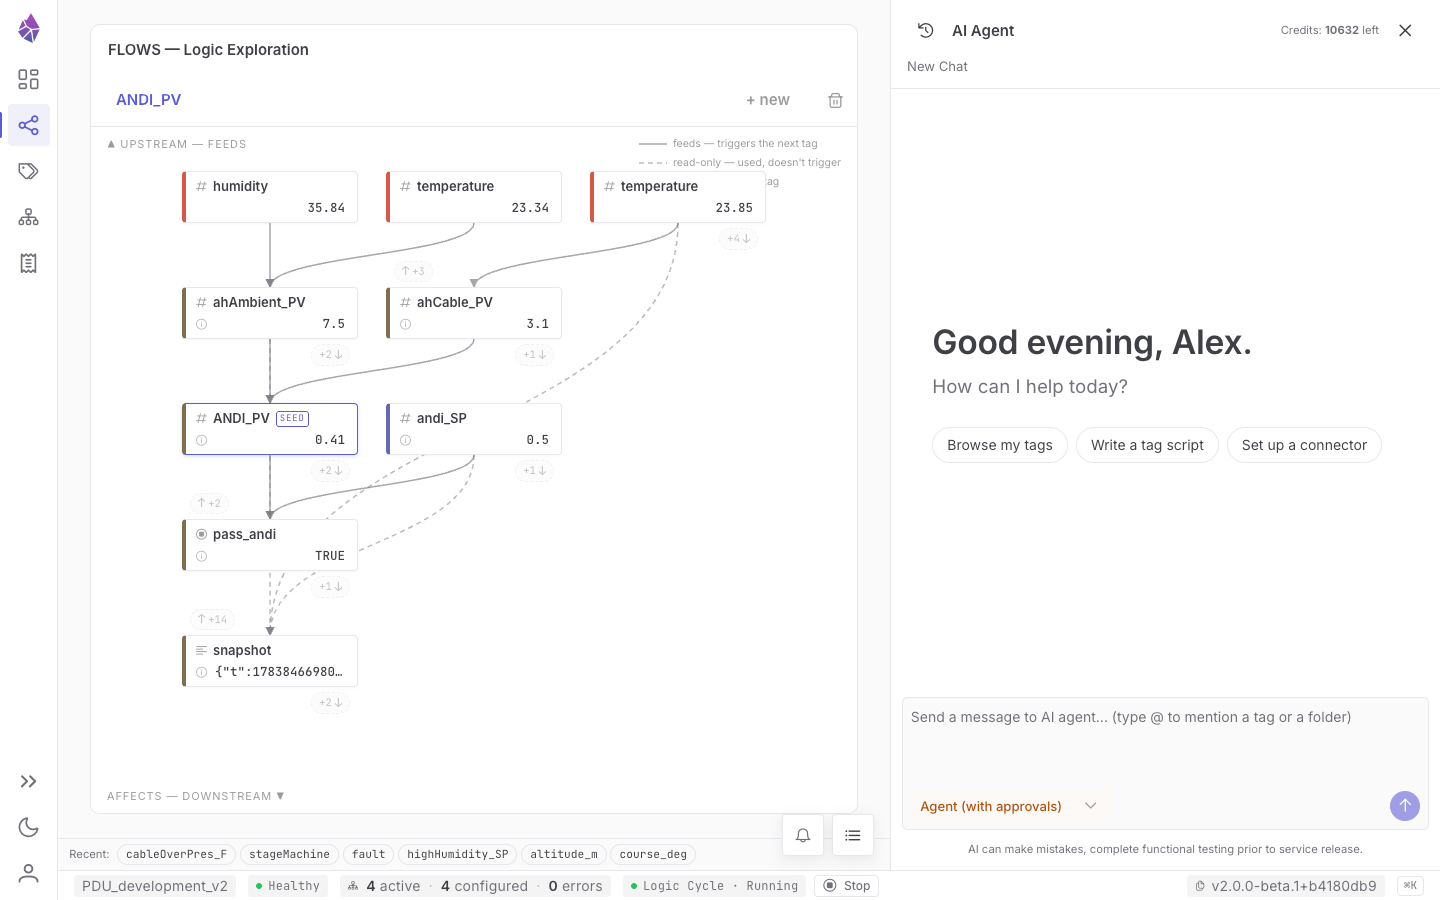
Flows are saved views: the tabs across the top switch between them, + new starts another, and the
bin deletes the one you’re on. Each chip shows the tag’s name and live value; a SEED badge marks
the tag the flow is anchored on, and the legend explains the line styles — solid feeds (triggers
the next tag), dashed read-only (used, doesn’t trigger) and dotted (through a deleted tag).
Asking Jasper about a flow is often quicker than reading it: it can seed a new one, describe an existing one, or narrow it to a single trigger path.